
Growth & productivity8 min
Planning coverage around your own demand: from gut feel to a roster that works
Aug 30, 2026
Almost every service team measures speed, volume and satisfaction. Almost nobody measures whether the answer was actually correct. The edit rate, the share of drafts changed before sending, is the one quality figure you can already read today without asking the customer anything.

Look at any service team's dashboard. There's an average response time, a count of resolved tickets, a CSAT score and perhaps a first-contact resolution rate. All four say something about how the conversation went. None of them says whether the answer was right.
That's an odd gap, because factual correctness is exactly what a customer judges you on. An answer within four minutes quoting the wrong return window costs more than an answer after an hour that is correct. The first one produces a second ticket, a correction and a customer who no longer knows which of the two versions is true.
One figure does say something about this, and many teams already produce it without noticing: how often a proposed answer gets changed before it goes out. Call it the edit rate. It's the cheapest quality measurement available, because the measuring happens while someone is simply doing their job.
The edit rate is the share of proposed answers that get changed in substance before being sent. If your team works with AI drafts, that's the share of drafts an agent modifies. If you work with reply templates, it's the share of templates that can't go out unchanged.
The formula is deliberately simple:
Edit rate = edited drafts / (sent drafts + edited drafts)
What matters is what you leave out. A draft someone discards and rewrites from scratch isn't an edit but a rejection. That belongs in its own figure, because the cause differs: with an edit the direction was right and a detail was wrong, with a rejection the system misunderstood the question.
Count only substantive changes. Someone adjusting a greeting or shortening a sentence corrects nothing. That distinction is why you can't establish this figure fully automatically: a text comparison sees that something changed, not whether it was the return window or a comma. In practice a sample beats an algorithm. Reviewing twenty edited drafts a week by hand gives a sharper picture than a percentage that counts every typo.
This is where introducing the measurement most often goes wrong. A team sees the edit rate drop from thirty to eight percent and concludes quality has improved. It might have. But two other explanations fit just as well, and both are worse.
The first is habituation. Agents who have approved fifty correct drafts read the fifty-first less carefully. That isn't sloppiness but a predictable response to a reliable system. So an edit rate that falls while reopened tickets rise isn't measuring your quality but your attention.
The second is a shift in the mix. Switch AI on for your simplest categories and never expand, and your edit rate drops because the questions got easier. So always measure the edit rate per category and never as a single total. An average across delivery questions and warranty disputes is a figure no decision can rest on.
The counter-check that covers this is simple: put the edit rate next to the number of reopened tickets over the same period. If both fall, things really are improving. If the first falls while the second rises, your team is approving errors that the customer then sends back.
An edit rate of zero rarely means everything is correct. Usually it means nobody is looking anymore.
The figure itself is the least interesting part. The value sits in the changes: every edit points to a place where information in your organisation is wrong, unfindable or contradicts itself.
Work through twenty edited drafts and check what exactly changed, and you'll nearly always find four kinds of cause. An outdated fact, such as a return window revised last year but still standing in one document. A missing fact, where nobody ever wrote down what happens to a damaged item after the return window. A contradiction, where two pages say something different and the system picked the wrong one. And tone changes, which aren't a knowledge gap but a setting.
Only the first three need repairing, and all three can be repaired at the source. That's the difference from a CSAT score, which tells you a customer was unhappy without saying which fact was wrong.
An anonymised example from our own practice: at one webshop the returns page stated a 100-day window while elsewhere on the same site a 30-day cooling-off period appeared. Both can legally coexist. Anyone correcting a draft picked afresh each time which of the two to quote. The edit there wasn't a system error but the signal that the source itself wasn't unambiguous.
You need no new software for this and no quarter of preparation. Four steps are enough.
Then measure monthly, not daily. An edit rate responds to changes in your knowledge sources, and those don't change by the day. Putting this in a weekly dashboard mostly means watching noise.
There are situations where the edit rate gives no usable signal, and it's more honest to name them than to recommend the measurement everywhere.
If you work without proposed answers, there's nothing to correct and you measure nothing. A team typing every answer from scratch doesn't have this figure and must establish quality differently, for instance by sampling and reading along.
At low volumes the outcome is unstable. Below roughly fifty proposals a month per category, the percentage swings so much that a ten-point change means nothing. Look at the edits themselves then and ignore the number.
And for questions without a factually correct answer, the measurement doesn't work. A complaint about the tone of an earlier email has no correct answer sitting in a knowledge source. There, an edit measures the agent's judgement rather than the accuracy of the information.
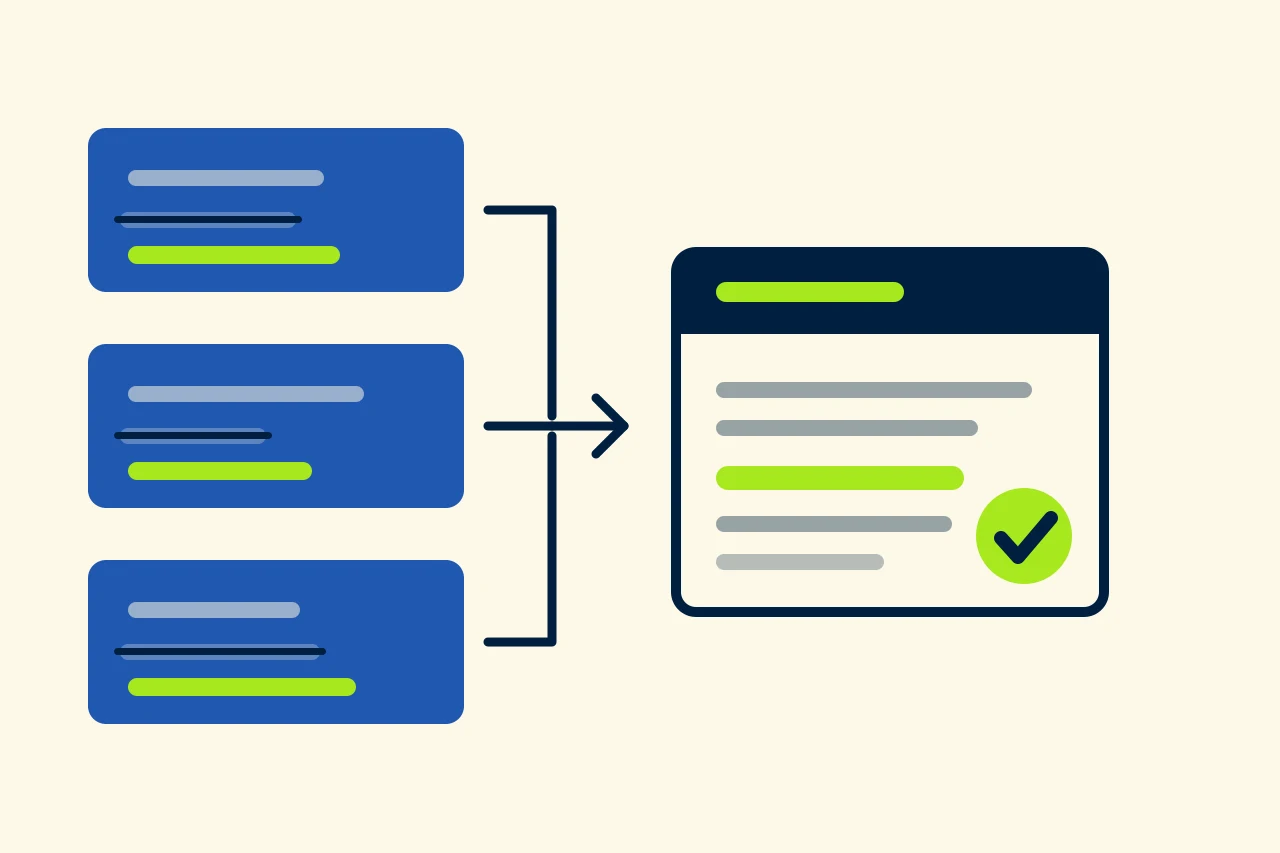
Product-neutrally, you need three things for this. A system that stores a proposed answer as a separate object rather than writing straight into the text field. A status per proposal distinguishing sent, edited and discarded. And a place where questions without a usable source become visible, so a knowledge gap doesn't stay in one agent's head.
In Cuego an AI draft sits as its own record on the conversation, with a status that distinguishes those three outcomes. Questions where the agent found no grounding in the knowledge base land separately in the knowledge-gap list, along with the original question and the channel. Together those two make the edit rate readable per category instead of as a single average across everything.
Start this week with one category and two weeks of manual tallying. You'll then have something few service dashboards show: a figure about the accuracy of your answers that doesn't depend on whether a customer bothered to fill in a survey.
Cuego
cuego.io
Your Cue to Go.
The Customer Contact Platform where conversations, customer data, knowledge, workflows, people and AI come together. Book a 30-minute demo and see it against your own situation.
30-minute demo · then we set it up together
Rather look for yourself first? Take the free website scan
See also
Everything in Cuego connects. Discover the modules, solutions and integrations that belong with this.